
|
|
|
|
|
|
|
|
|
|
|
|
|
|
|
|
|
|
|
|
|
|
|
|
|
THETA AG
|
|
|
Tel. +41 44 217 80 14
|
|
|
|
|
|
|
|
|
|
|
|
|
|
|
|
|
|
|
|
|
|
|
|
|
|
|
|
|
|
Similarities
|
|
Multi Asset View
|
|
|
Index Family: [dynAAx World]
|
|
|
|
|
|
|
|
|
|
|
|
How to read this graph
|
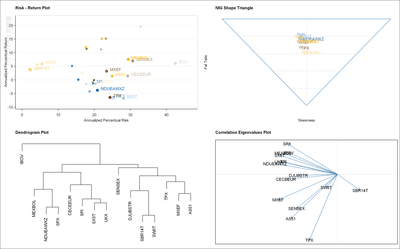
Finding similarities in groups of assets which are pre-selected for a portfolio goes beyound a pairwise comparison. All assets will be considered at the same time to arrange the grouping. This can be achieved just by eye inspection as shown in the first two plots, or by a statistical approach as shown in the last two plots.
The first graph compares the risk versus the return of the assets. The "big" points give the empircal standard deviation (risk) vs. empirial mean (return). As more the points are placed to the right in the plot as more they have to be considered risky. The "small" dots are based on a robust estimate of mean and covariance. As more as the small and big points are separated as more the empirical data records are influenced by extreme and outlying values. So assets whose pairs of points have longer distance have to be considered as more risky.
The second graphs considers skewness and kurtosis. To relate these two quantities for each asset we have fitted the distribution with a normal inverse Gaussian, NIG, distribution function which allows for skewness and kurtosis in contrast to the normal distribution function. In the so called NIG shape tringle, points to the left are on the loss side, points to the right are on the gain side. The kurtosis increases from moving above from the lower cusp of the tringle which reflects the normal case. So assets points which are close to the lower cusp are less risky than those further away.
The third graph uses the statistical approach of hierarchical clustering to detect dependencies.
The fourth graph uses the statistical approach of principal component analysis to detect dependencies.
|
|
|
|
|
|
|
|
|
|
|
|
|
|