
|
|
|
|
|
|
|
|
|
|
|
|
|
|
|
|
|
|
|
|
|
|
|
|
|
THETA AG
|
|
|
Tel. +41 44 217 80 14
|
|
|
|
|
|
|
|
|
|
|
|
|
|
|
|
|
|
|
|
|
|
|
|
|
|
|
|
|
|
Performance
|
|
Index View: dynAAx World Risk-/Return Opt.
|
|
|
Index Family: [dynAAx BVG]
|
|
|
|
|
|
|
|
|
|
|
|
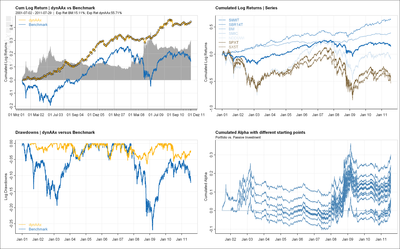
How to read this graph
|
The graph shows four views on the performance of the optimized portfolio.
The first plot shows the daily cumulated log returns (thin black line) of the benchmark series indexed to 1 at the beginning. The daily index is overlayed by monthly values (thick blue line). The second curve (thick yellow line) shows the cumulated returns of the optimized portfolio at the end of each month. The optimized portfolio is indexed to the same value as the benchmark index at the start of the optimization. The backtest was done with a rolling window of constant length shifted on a monthly base. The vertical gray bars measure the difference between the two series. As better the bars increase continuously smooth in time, as better we consider the portfolio strategy used to achieve this result.
The second plot shows the cumulated log returns of the individual compounds of the portfolio compared to the benchmark portfolio (thick blue line). All curves are indexed to 1 at the beginning of the series.
The third plot compares the drawdowns of the optimized portfolio (thick yellow line) with those from the benchmark portfolio (thick blue line).
The fourth plot compares the alpha's with changing dates of invention of the portfolio.
|
|
|
|
|
|
|
|
|
|
|
|
|
|
|
|
...go back to graph matrix
|
|
|
|
|
|
Other functions available
|
|
Performance
|
|
|
|
|
Other sub-indices of index family
|
dynAAx RF BVG/LPP
Ridge Frontier
|
|
|